Le mie bellocce
Spaces that explore the relationship between people and indoor plants in online platforms
Authors
Margherita De Alessandri, Laura Falanga Peri, Roberta Florian, Veronica Leoni, Letizia Percuoco, Sara Pugliano
In urban environments, indoor plants serve as a vital link to nature and a central part of domestic life. Online, they are increasingly seen not just as décor but as companions, much like pets: digital communities share tips, stories, and experiences about their beloved plants.
This project analyzed 244 pieces of content, 235 users, and 93 comments on houseplants across five platforms, identifying 46 plants, 450 expressions, and 194 images. Expressions were categorized into five clusters: affectivity, health, peculiarity, other, and recreational use.
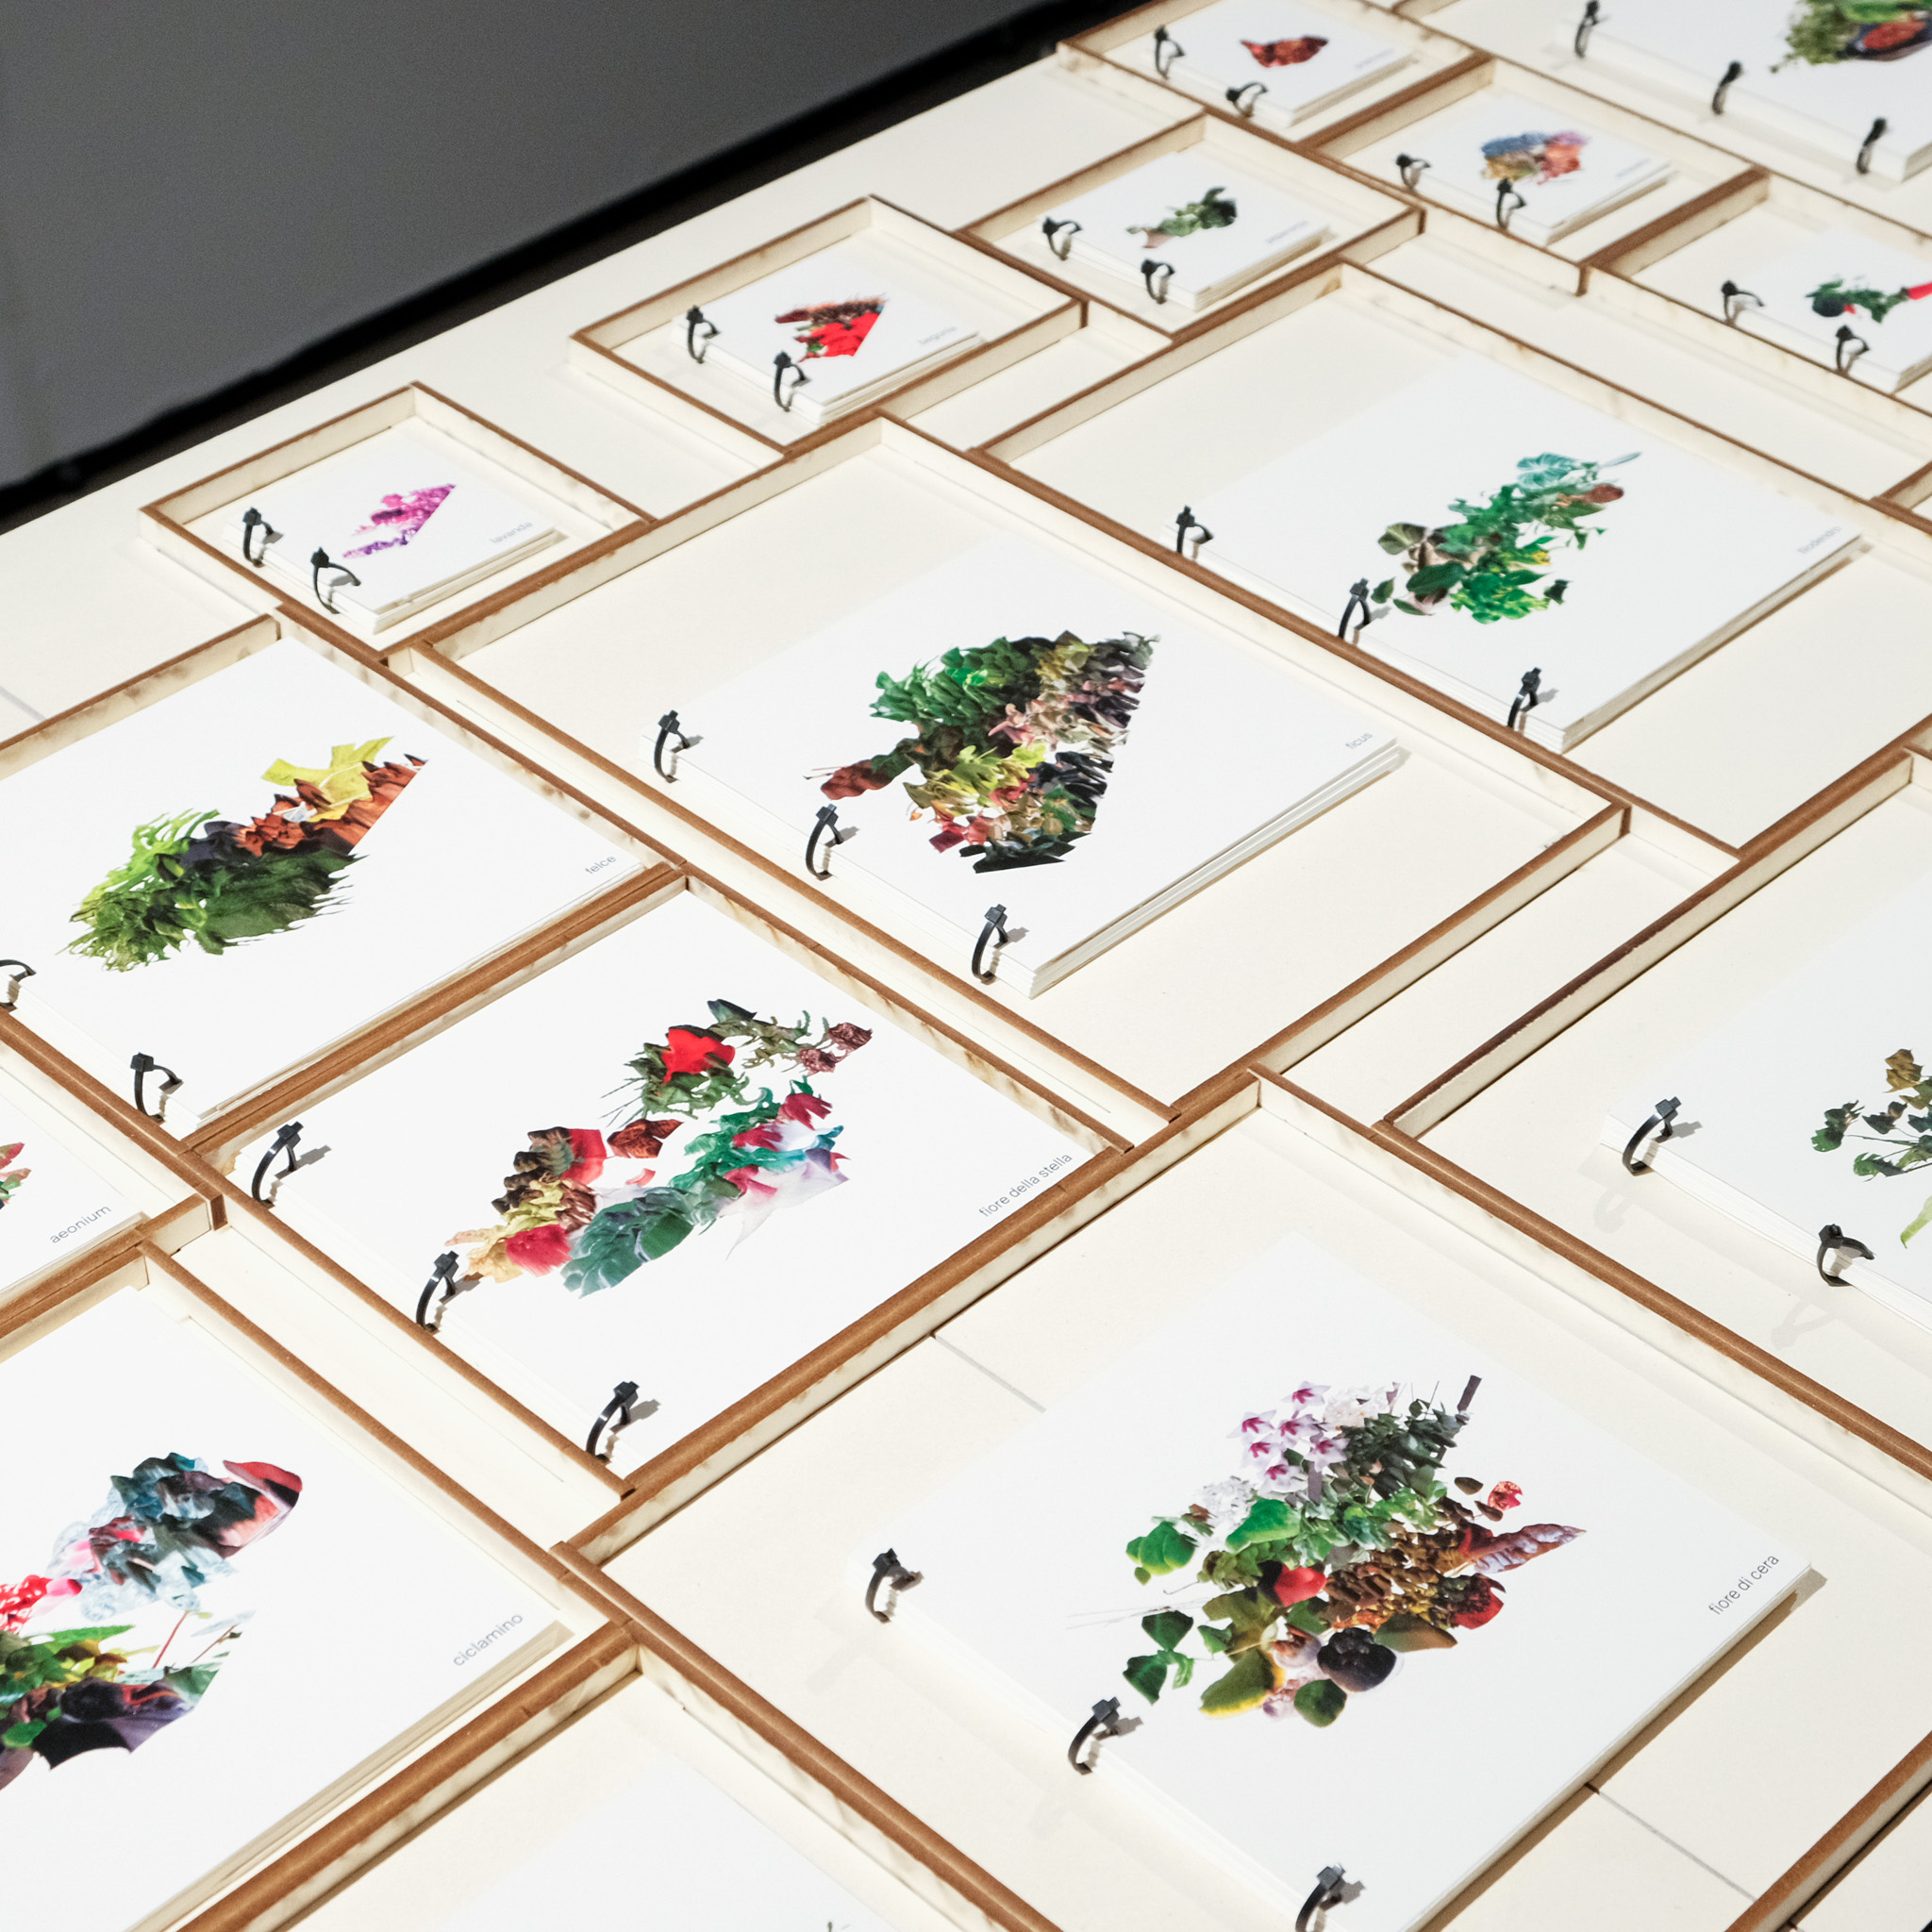
The plant collection forms a living ecosystem, with each species given a dedicated room, its size reflecting the number of associated expressions. No longer mere decorations, plants take center stage, sharing their stories through users' expressions recorded in books. The covers visually depict all plant-related images, creating a vast green expanse that highlights their unique characteristics
Design process
The dataset used for the project consists of 250 contents (videos, posts, articles, tweets, comments), 240 users, and 96 comments related to indoor plants, collected on five platforms: Facebook (25), Google (11), TikTok (23), Twitter (18) and YouTube (26). The analyzed content was published online until October 2024. For each platform, the first 10 results suggested by the algorithm were examined using the queries: “coltivazione piante indoor”, “consigli piante da casa” and “cura piante da interno”. The dataset is available in this link.
In the initial phase, all content was collected into a dataset that included information such as platform, URL, user, and content type (description, comment, response to the comment). In some cases, the same video was found in multiple search queries. The content was then analyzed from a linguistic point of view, focusing on the expressions used by users to describe their plants and their experiences. Shared images and video screenshots of the different plants were also collected.
This analysis identified 57 plants, which were linked to 461 expressions and 199 images. In-depth analysis of the comments, we have manually isolated some keywords that were grouped into broader terms to simplify the analysis (e.g., beautiful, beautiful, and very beautiful were classified under beautiful). The generalized terms were then organized into 10 clusters, which were further consolidated into 5 main categories:
- Affectivity: expressions that reflect emotions, opinions or human status (e.g., "what beautiful roots").
- Health: expressions describing the state of health of the plant, both in terms of growth and malaise (e.g., "it's almost yellow").
- Peculiarities: adjectives and terms describing the appearance and distinctive features of the plant (e.g., "Teresina variegated and also very red").
- Recreational use: expressions which indicate specific uses of the plant, for example as a narcotic (e.g., "Many reed warblers won't need the dealer").
- Other: expressions which do not fall into any of the above categories (e.g. “#thingsfromanotherworld”).
To simplify and make the data more meaningful, we have excluded the plants associated with a single expression, obtaining a final dataset composed of 244 contents, 235 users 93 comments [Facebook (24), Google (10), TikTok (23), Twitter (18) and YouTube (26)], 46 plants, 450 expressions and 194 images.
Planimetry: room design
PFor the design of the floor plan, the number of expressions associated with each plant was used to determine the size of the rooms. To this end, the column for plants was extrapolated from the dataset. The data were then processed with RAWGraphs, generating a treemap that visually represents relative spatial proportions. The resulting graph was then imported into AutoCAD, allowing the design of the floor plan of the 46 rooms.
General dataset from which the data for RAWGraphs was extracted.
Original treemap made with RAWGraphs.
Plan drawn up accordingly.
Each room is made of vegetable cardboard 4 mm thick, an environmentally friendly material, lightweight, and at the same time resistant. To ensure greater structural stability, each wall has been designed with a system of joints directly in the base, which allows easy assembly of the various components. This system not only allows to optimize the solidity of the structure, but also to facilitate the dismantling and reuse of materials, making the project sustainable and versatile.
Interlocking technology.
Indoor plant catalogs
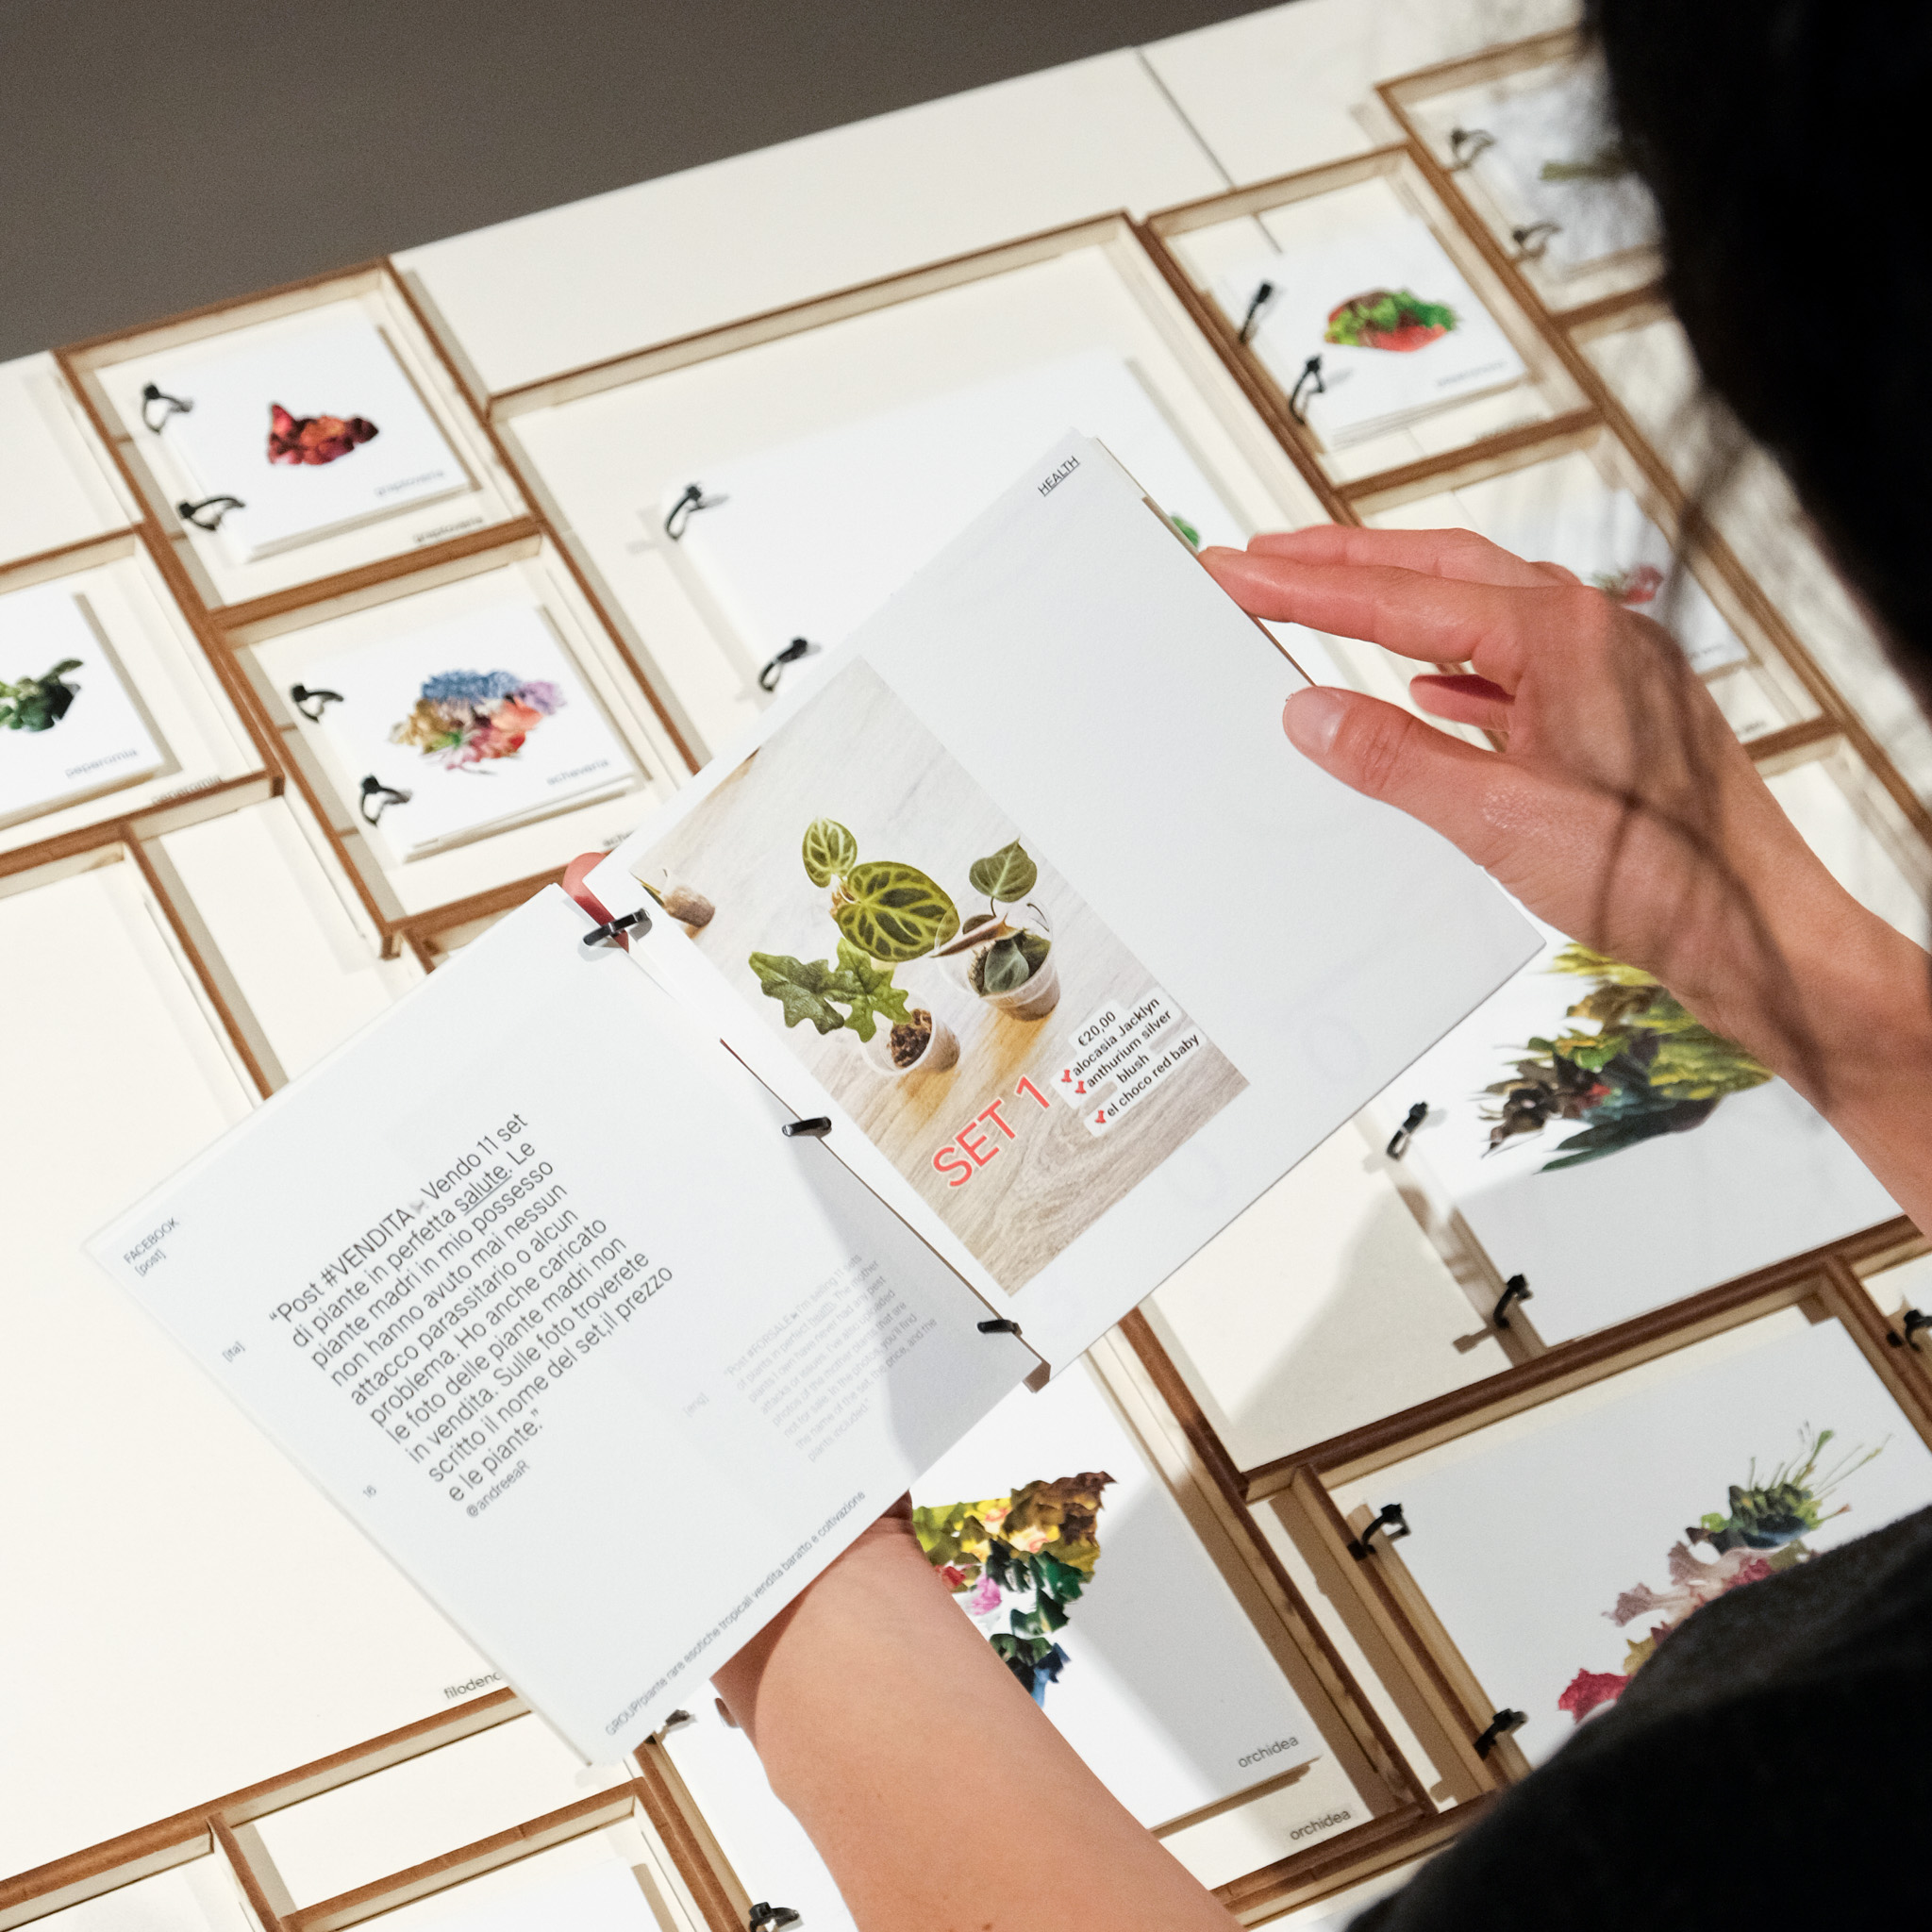
Inside each room, there is a catalog that collects expressions for each platform divided into categories with associated users and images. For visual consistency with the size of the rooms, 2 formats have been defined. Plants associated with 2 to 5 expressions, fall in the format 7x7cm. Plants with more than 5 expressions, fall in the format 15x15cm. The contents are organized by platform, in alphabetical order. As a result, the categories are sorted by quantity of items.
The information provided in the catalogs is: the source platform (including the names of the Facebook groups and titles of the YouTube videos), the type of content (post, video transcription, comment), the user name of the author (were invented for privacy reasons, keeping instead intact shops and public figures) and the category of belonging of the comment.
The original spelling has been retained to maintain the authenticity of the data, underlining the keywords contained in the expressions. To ensure accessibility for a wider audience, all content has been translated into English. Each text content is associated with images or screenshots; otherwise the phrase "missing image" is displayed. Visual content is maintained in the same format as it is presented on the platform and placed on the page according to its category, creating a logical connection between the information.
Layout Cannabis catalogue.
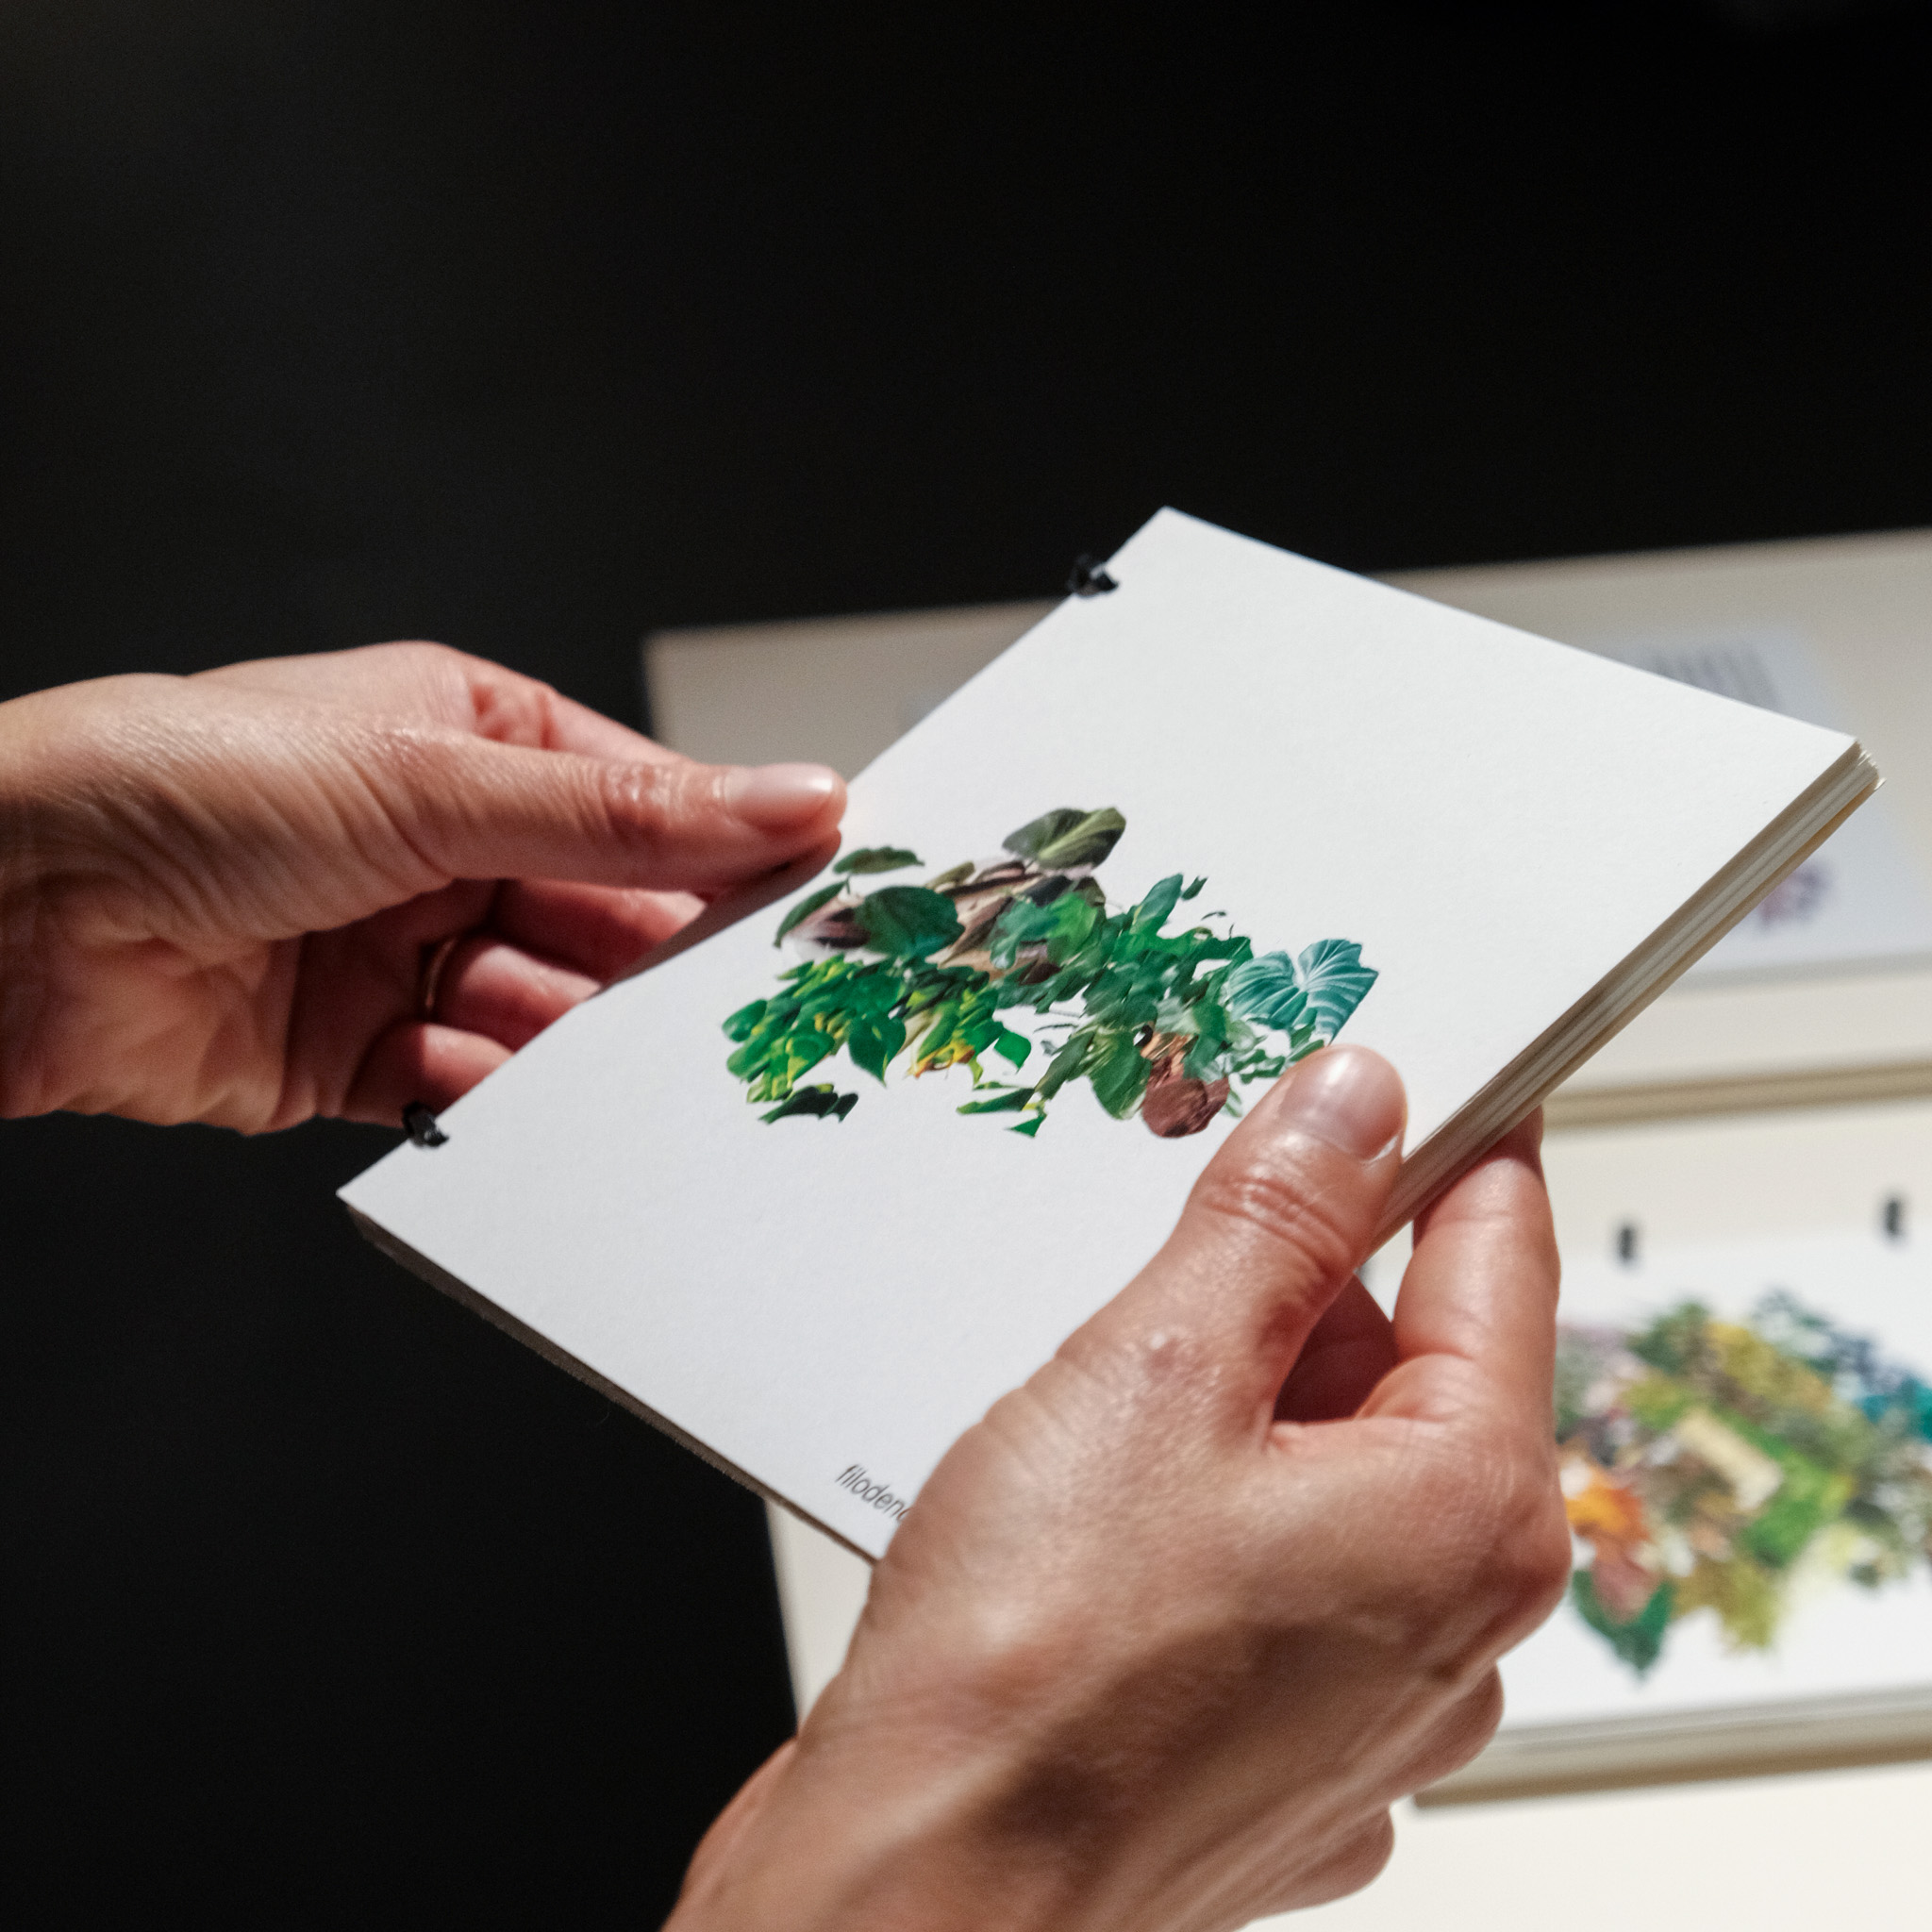
The binding, made with black ties, recalls the method used in gardening to provide more support for the plants.
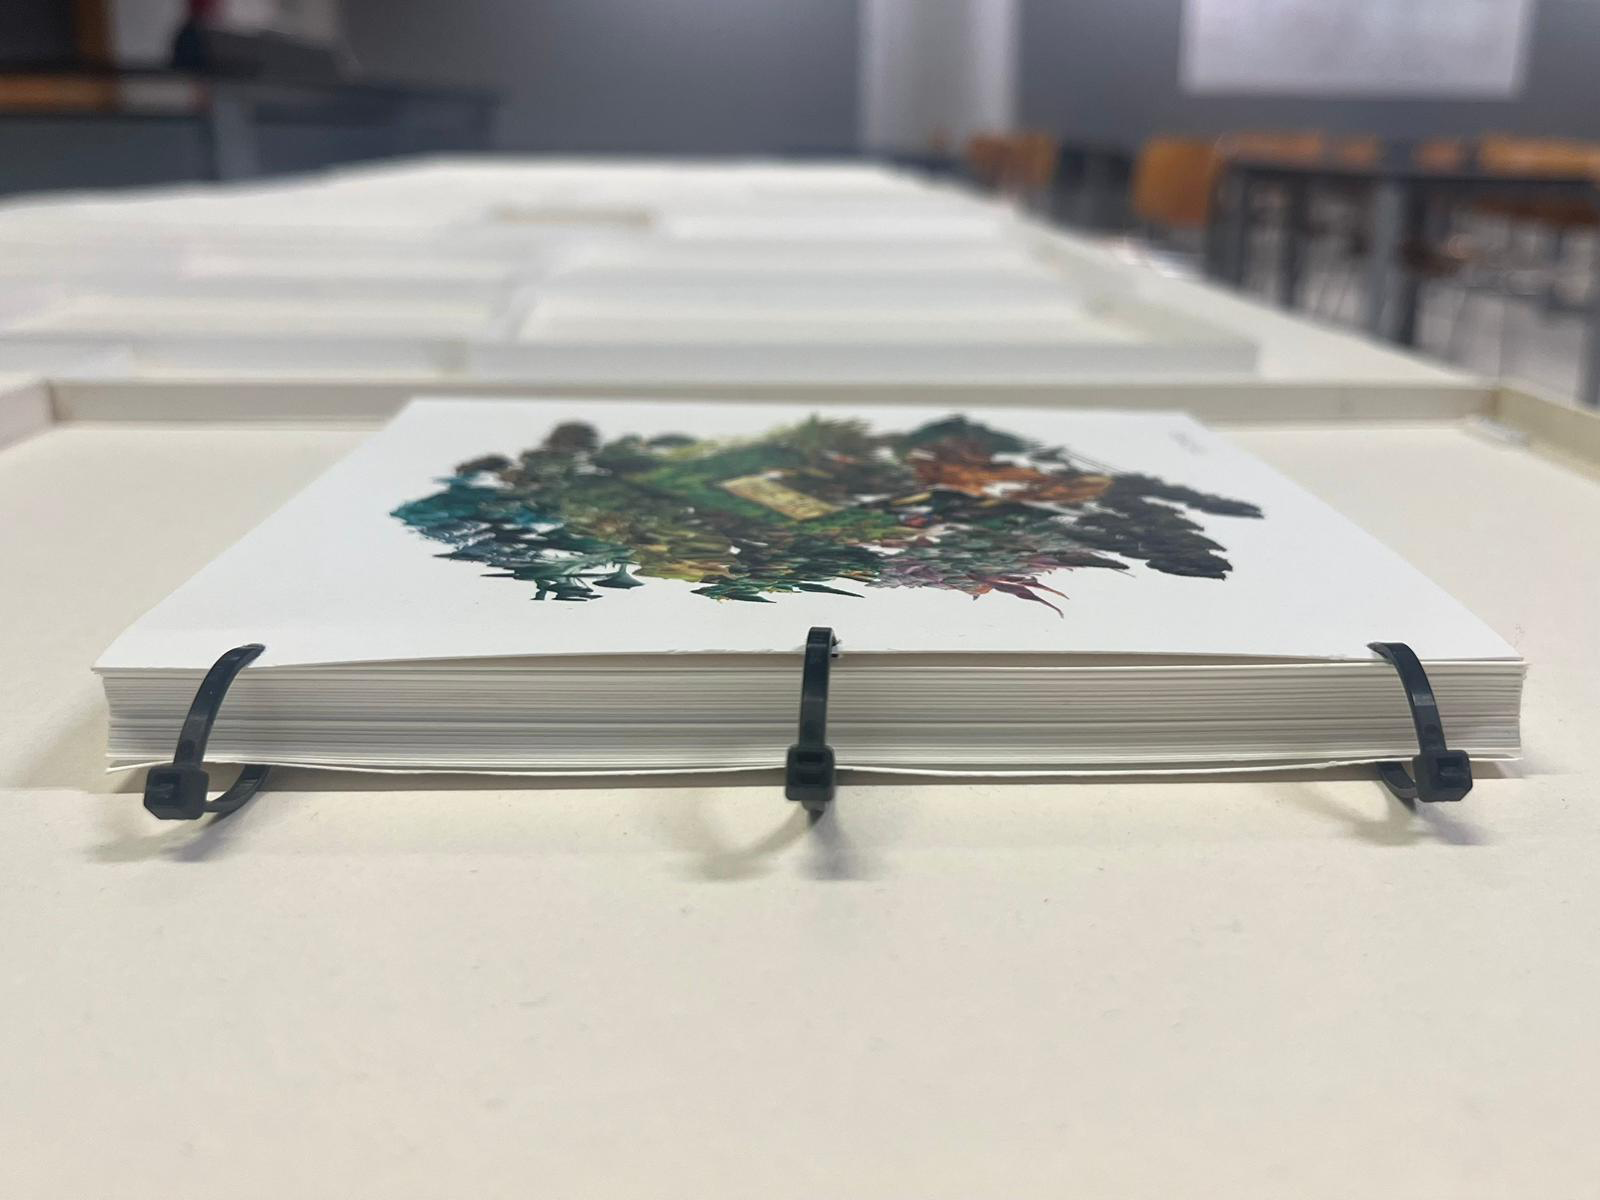
Cannabis catalogue binding.
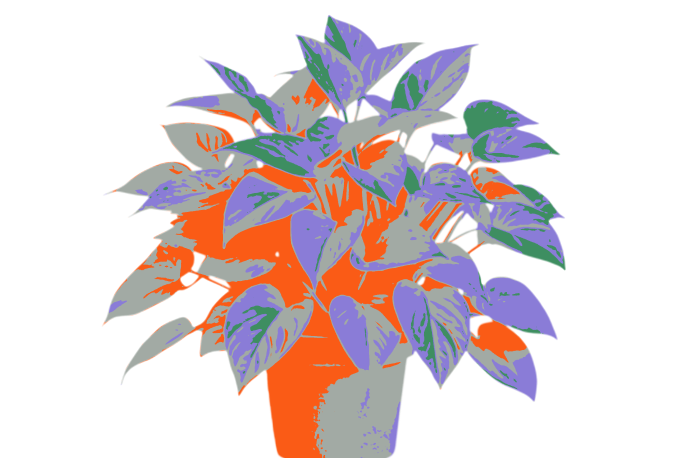
The catalog’s cover provides a visual summary of users' shared images for each plant. To achieve this, the images were clipped using "Select Object" tool in Photoshop, to isolate the plants from their respective backgrounds. The resulting convolutions were later imported into ImageJ, where they were modified to work on the luminance of the images using the 3D Interactive Surface Plot plugin. This process has made it possible to highlight the predominant colours and chromatic characteristics of each plant. Finally, the edited images were assembled into a collage that evokes a vast green expanse. This visual representation allows each plant to stand out as a single entity, highlighting its individuality with the others
"Select object”, Photoshop.
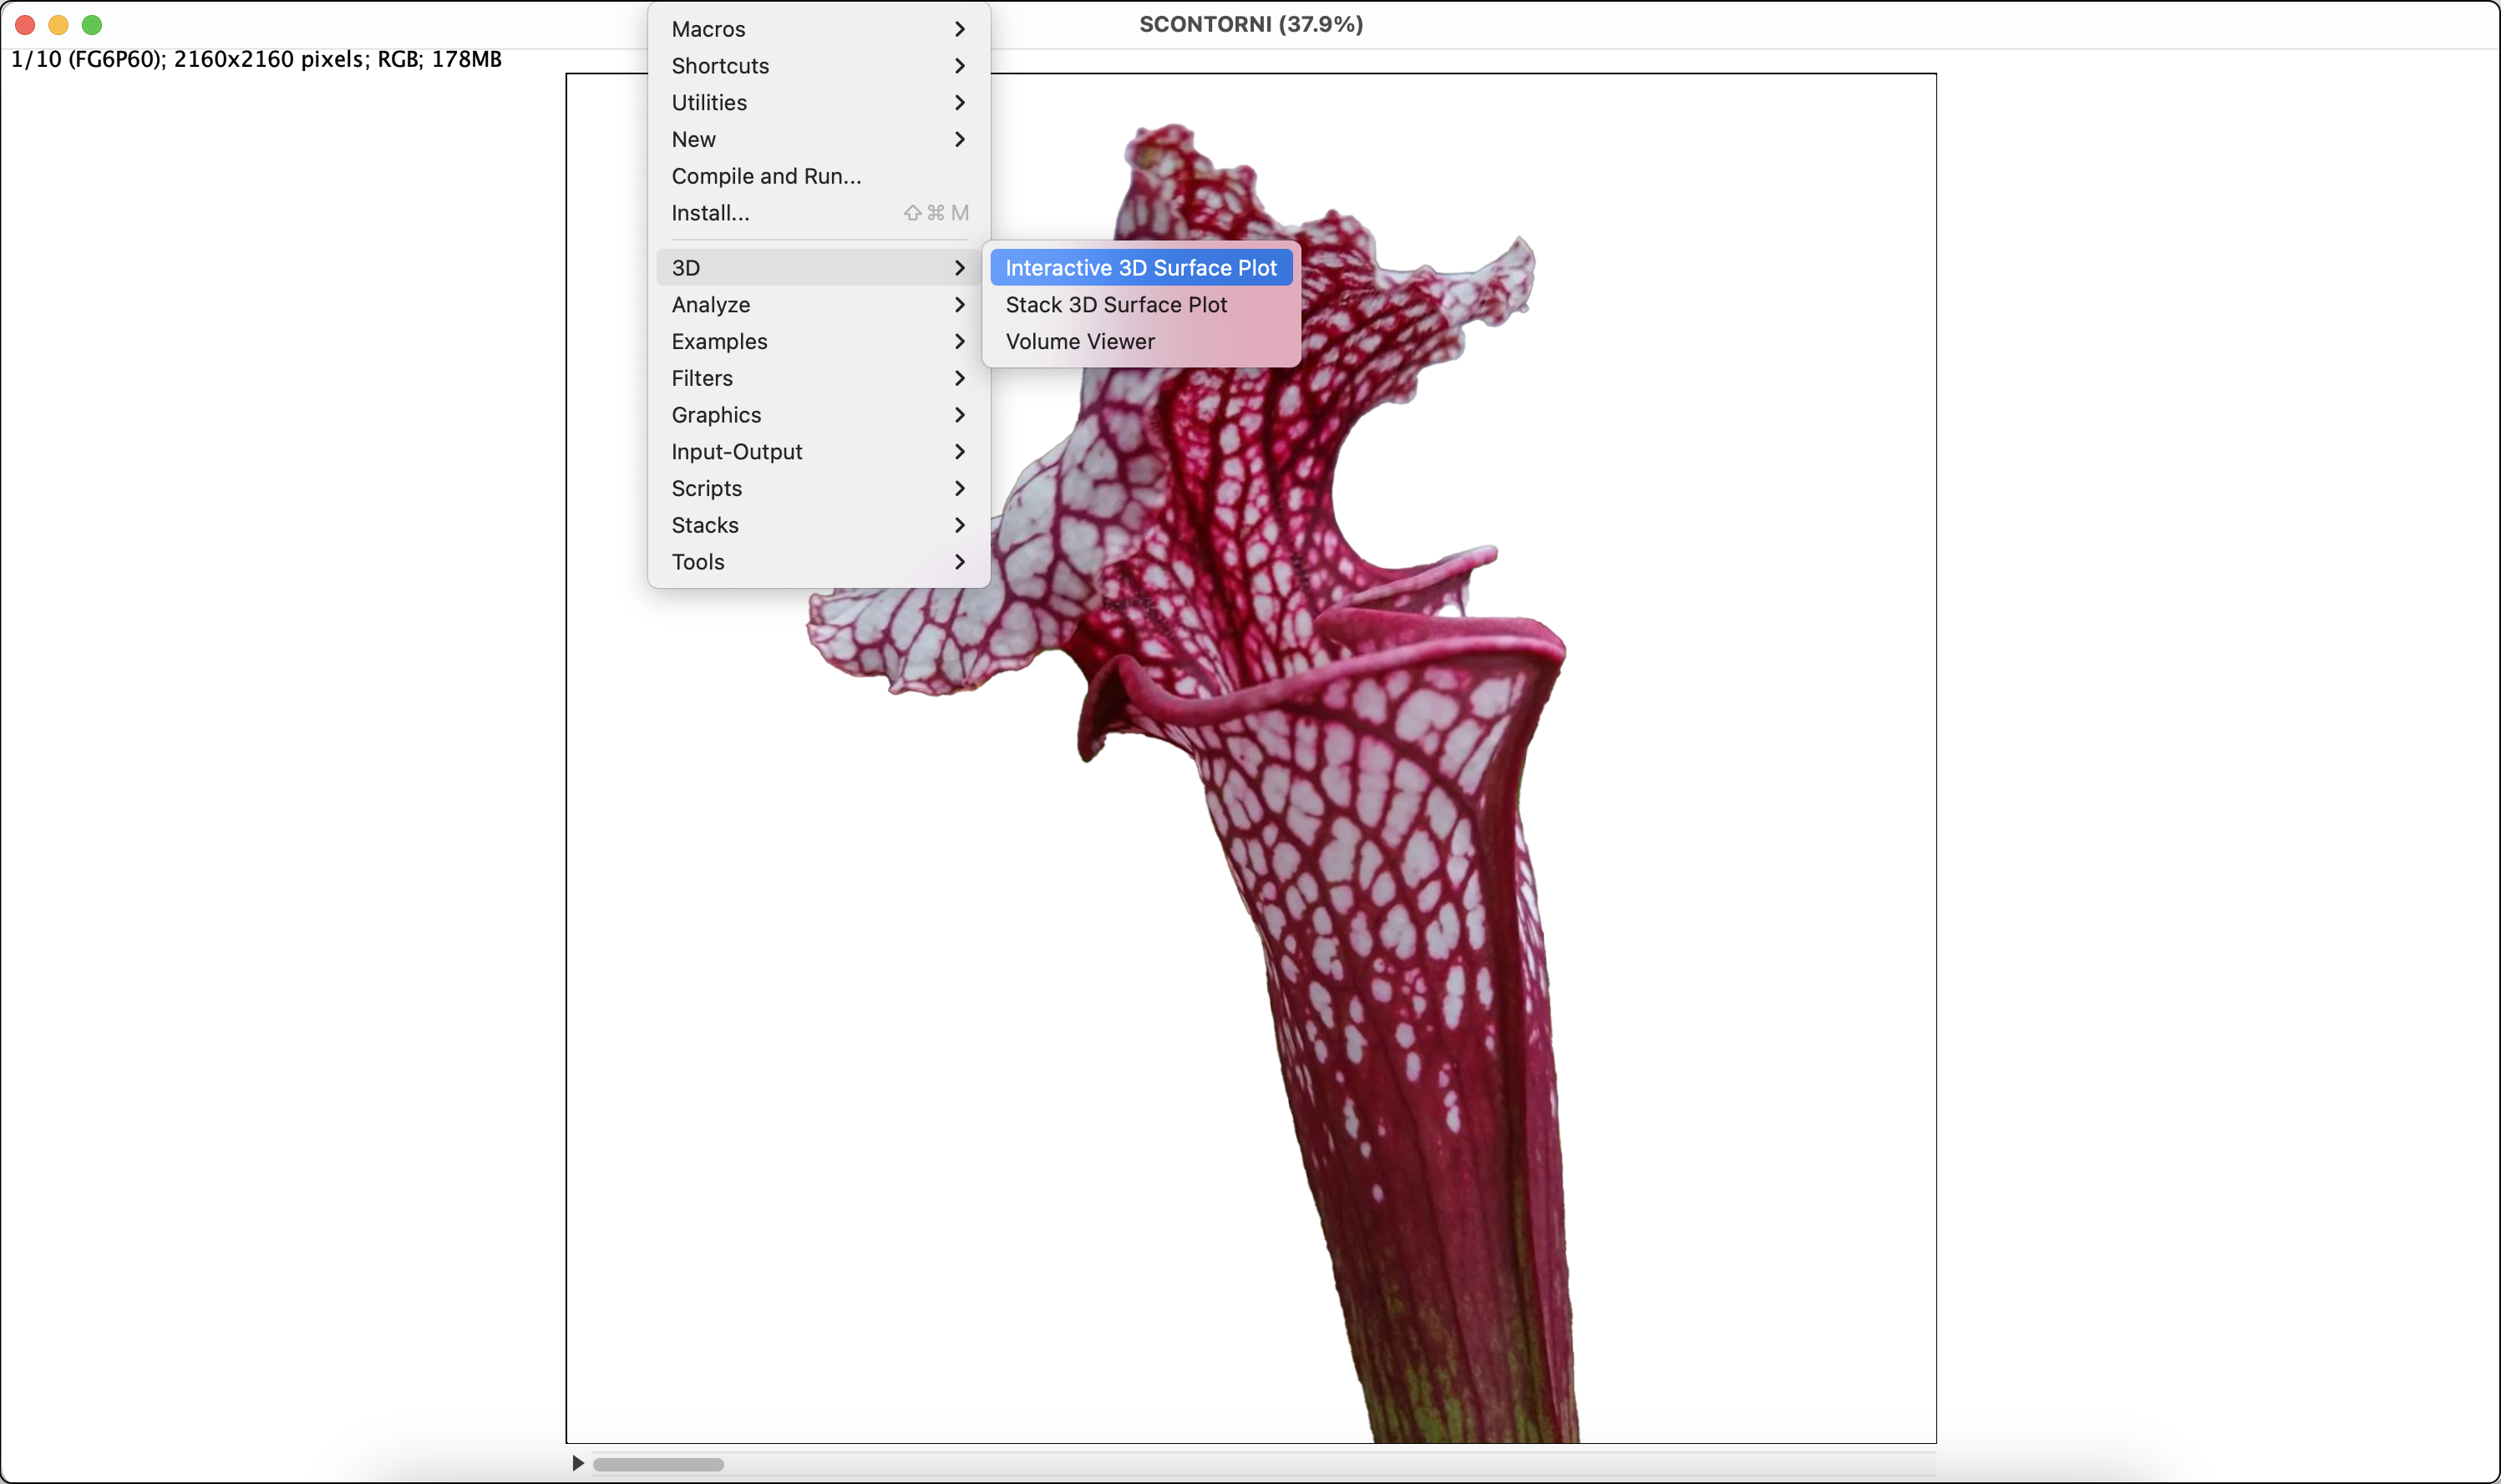
“Interactive 3D Surface Plot”, ImageJ.